This function uses ggplot2 framework to plot semivariogram object results from
fit_variogram.
Arguments
- object
An output from
fit_variogramfunction- length
(integer) the length of sequence used to produced fitted data.
- show_range
(logical) whether to display range in the plot
References
Pebesma, E.J., 2004. Multivariable geostatistics in S: the gstat package. Computers & Geosciences, 30: 683-691. Benedikt Gräler, Edzer Pebesma and Gerard Heuvelink, 2016. Spatio-Temporal Interpolation using gstat. The R Journal 8(1), 204-218
Hiemstra, P.H., Pebesma, E.J., Twenhofel, C.J.W. and G.B.M. Heuvelink, 2008. Real-time automatic interpolation of ambient gamma dose rates from the Dutch Radioactivity Monitoring Network. Computers & Geosciences.DOI:
H. Wickham. ggplot2: Elegant Graphics for Data Analysis. Springer-Verlag New York, 2016.
See also
autofitVariogram, fit_variogram,
plot_variogram
Examples
## Run semivariance on Principal Component Axis1
# read data
data("landcover")
vfit <- fit_variogram(data = landcover, response = "MPC1", coords = NULL)
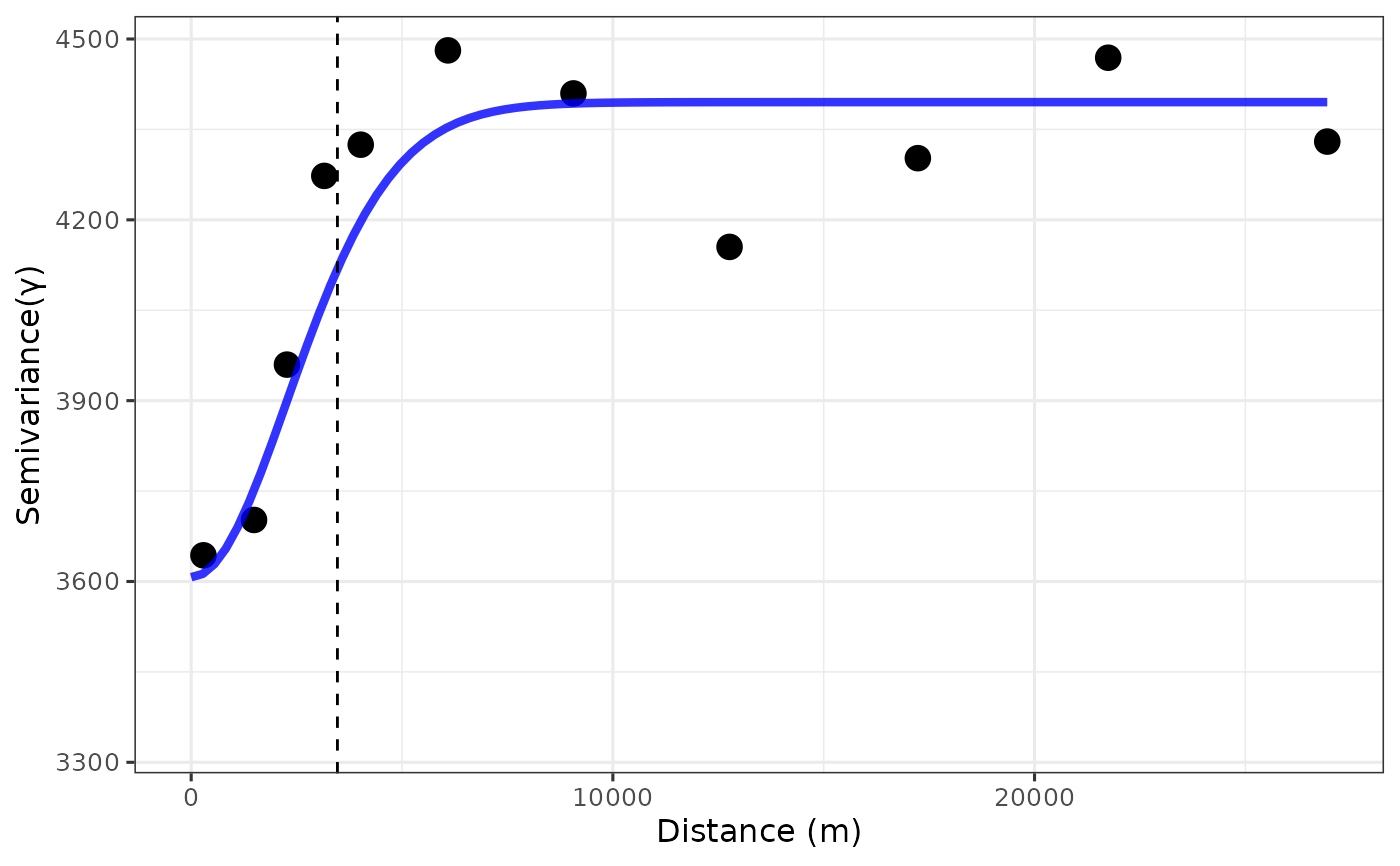
vplot <- plot_variogram(object = vfit, length = 99, show_range = TRUE)
# plot
vplot$plot
 vfit_pc2 <- fit_variogram(data = landcover, response = "MPC1", coords = NULL)
vplot_pc2 <- plot_variogram(object = vfit_pc2, length = 99, show_range = FALSE)
# plot
vplot_pc2$plot
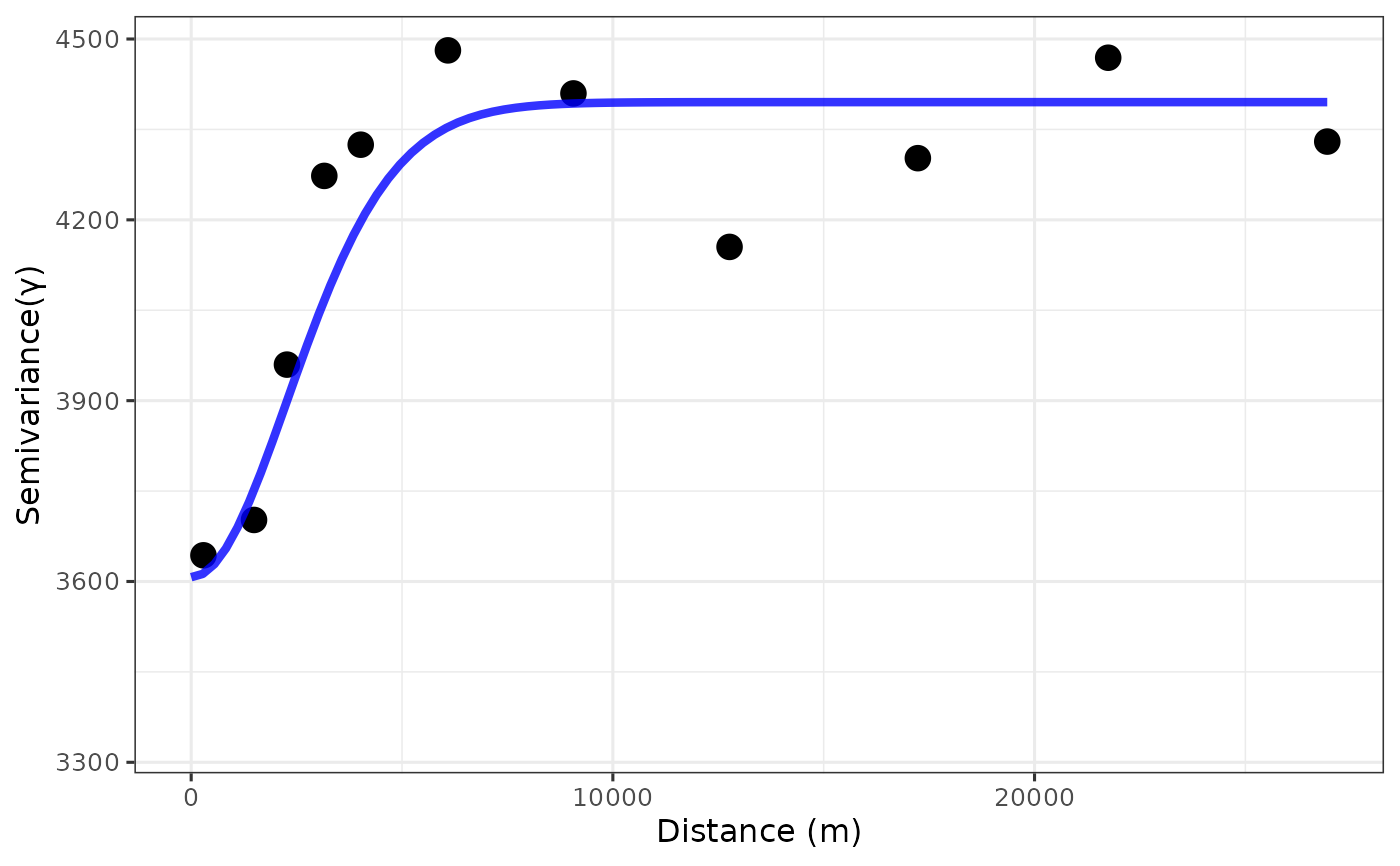
vfit_pc2 <- fit_variogram(data = landcover, response = "MPC1", coords = NULL)
vplot_pc2 <- plot_variogram(object = vfit_pc2, length = 99, show_range = FALSE)
# plot
vplot_pc2$plot
 if (FALSE) {
data("landcover")
vfit <- fit_variogram(data = landcover,response = "ASYM",coords = NULL)
vplot <- plot_variogram(object = vfit, length = 99, show_range = TRUE)
# plot variogram
vplot$plot
# data
vplot$data
}
if (FALSE) {
data("landcover")
vfit <- fit_variogram(data = landcover,response = "ASYM",coords = NULL)
vplot <- plot_variogram(object = vfit, length = 99, show_range = TRUE)
# plot variogram
vplot$plot
# data
vplot$data
}